We have moved to a new website. You are being redirected!
What is happening in DC this summer? The City appears to be in the midst of a crime surge with a new high-profile shooting, stabbing, or violent assault every week. Does the crime data support this observation? This post will examine the DC crime rate so far this year compared to the rate during the last five years.
DC’s crime incidents data can be found
here. The source code for the data analysis can be found
here.
DC Violent Crime Rate
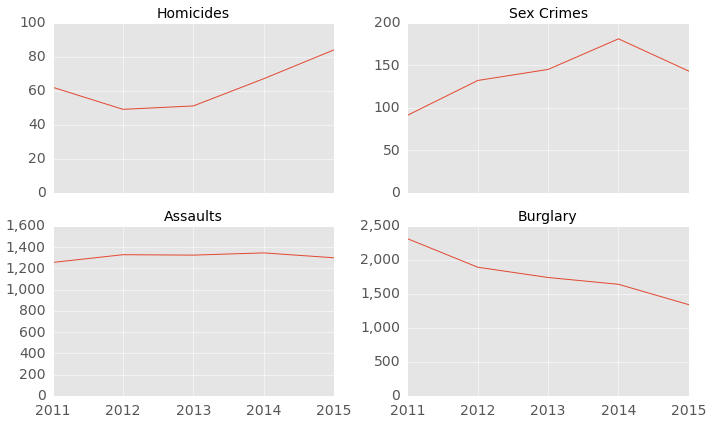
Let’s take a look at the annual crime rate of four key types of violent crime reported by Metro PD: homicides, sex crimes, assaults with a deadly weapon and burglaries. Since we’re only halfway through 2015, the charts below only consider crimes reported between January and July of each calendar year (rather than the entire calendar year). The number of homicides is up since hitting a recent annual low in 2012. Other violent crimes, however, are down so far in 2015. Let’s take a closer look at the homicide rate.
Figure 1. DC Violent Crime Incidents by Year (January to July of Every Year)
DC Homicide Rate
Figure 2 below shows the monthly homicide rate from January 2011 to July 2015 (the last month in 2015 for which a full month of data is available). The number of homicides seems to have increased in 2015. However, it's difficult to get a sense for the overall trend given the volatility in the number of homicides in any given month (not surprising given the low number of data points).
Figure 2. Monthly Homicide Rate (January 2011 to July 2015)
We can smooth out the month-to-month variability by calculating the monthly rate on a 3-month rolling average basis (Figure 3 below). It is clear that DC's homicide rate has surged in 2015 compared to the period from 2011 to 2014, and the increase hasn’t been a one-off monthly increase but a sustained multi-month jump that shows no sign of letting up. The monthly homicide rate has jumped from about eight per month on average from 2011-2014 to about 12 per month on average so far in 2015 (from January to August), and to 17 per month as of today (August 2015).
Figure 3. Monthly Homicide Rate (Rolling 3-Month Average)
As of August 2015, DC’s average monthly homicide rate is more than twice as high as the average rate during the period from 2011 to 2014. At this pace, DC is set to exceed 180 murders in 2015, compared to 92 reported in 2013 (excluding the 12 killed during the Navy Yard shooting). The last time DC's homicide rate exceeded 180 was in 2008, before the City succeeded in cutting the murder rate in half between 2008 and 2013 to a multi-decade low. Could the homicide rate just be reverting to the mean?


0 comments: